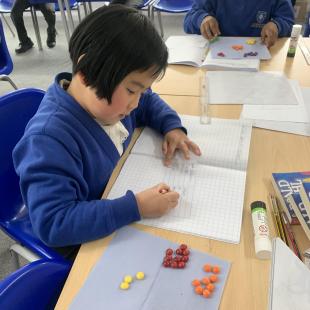
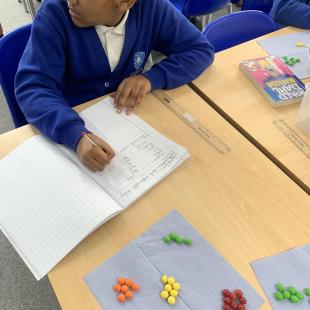
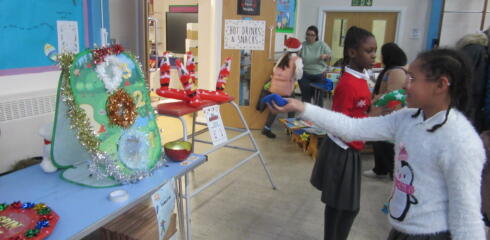
In Asteroids, we have been learning about statistics and different ways to represent data. Today, we carried out a skittles investigation and represented our findings in a tally chart. We looked at which colour as the most popular in our packets and also compared the difference between the most common colour and the least common colour.


